
We help homeowners
remove gravel, concrete, artificial turf & more
to upgrade your yard with beauty & permaculture.
Material Categories & Disposal Methods
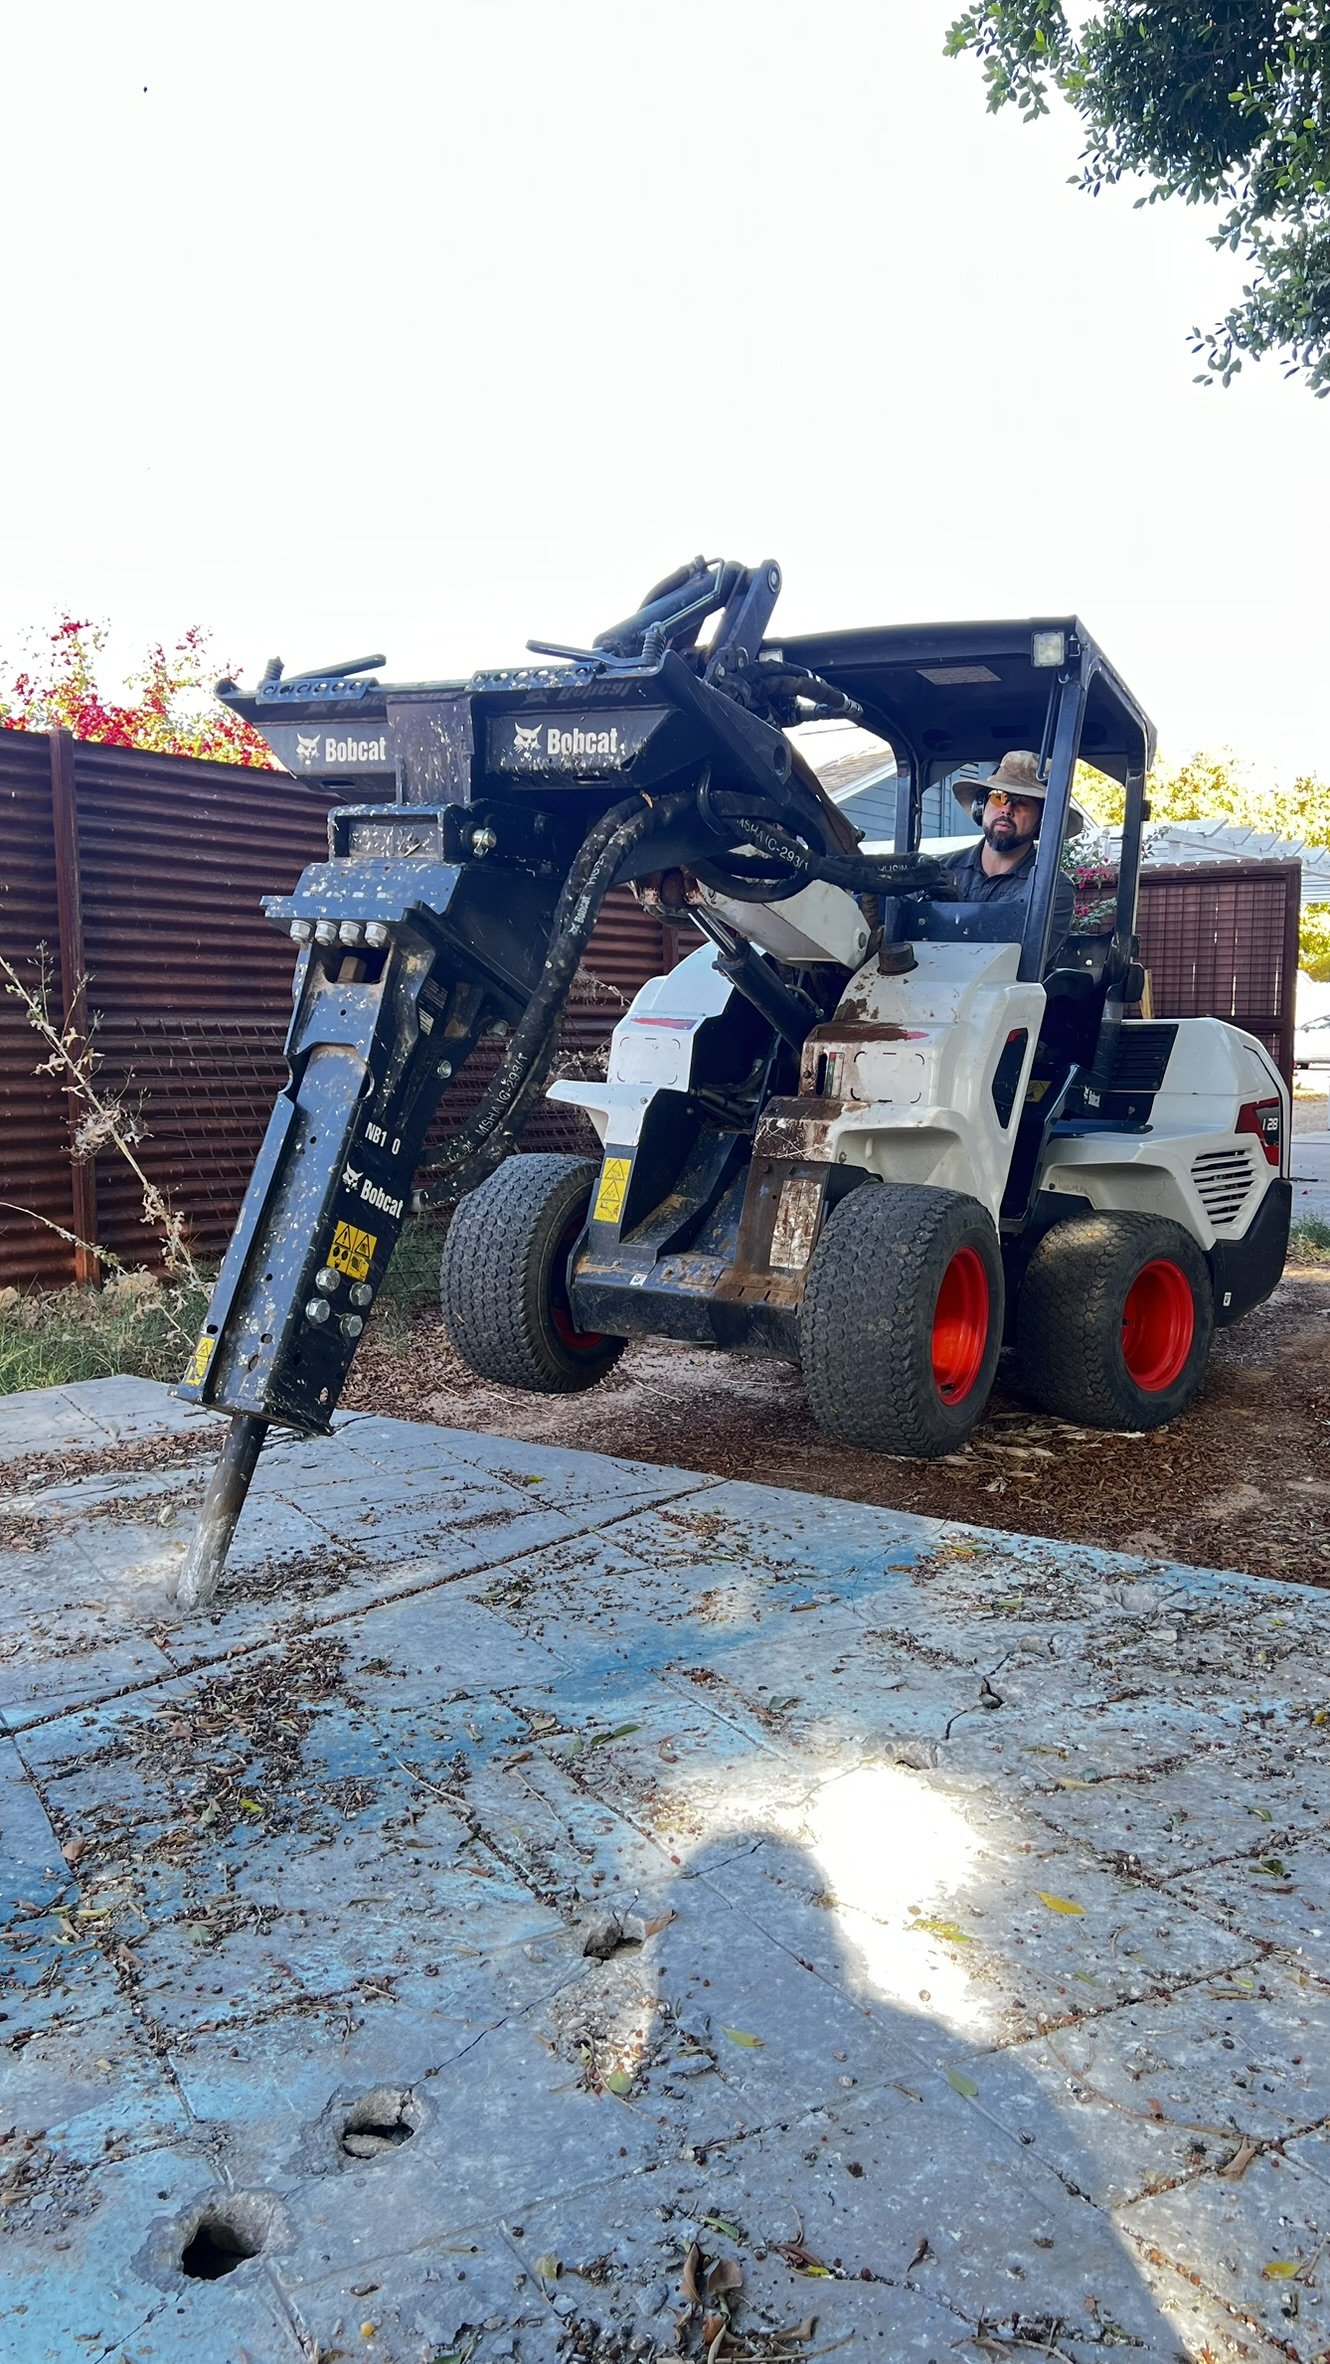
Gravel & Concrete
Hardscape materials like concrete make Phoenix hotter and drier, especially when unshaded. We remove it whenever it’s unnecessary to achieve a project’s goals.
Whenever possible, we reuse gravel in other areas or projects. The rest goes to the inert dump, which is the least toxic form of landifll.

Grass Lawns
Though living lawns can cool down Phoenix, they’re also quite thirsty. If unused, we like to reduce or remove them entirely. When they are used, we improve soil structure and species diversity to reduce water needs.
Living sod removal gets repurposed in other yards whenever possible, otherwise goes to the regular dump (which actually helps build soil there ironically).

Artificial Turf
Contrary to what all the rebate programs in the Phoenix area might make you believe, fake grass is making our Heat Island effect worse—not only because it’s hotter, but because it destroys the soil microbiome underneath it.
We never reinstall AstroTurf due to the chemical detriments, so it all goes in the inert dump as well, until we have a better way to dispose of it.
